

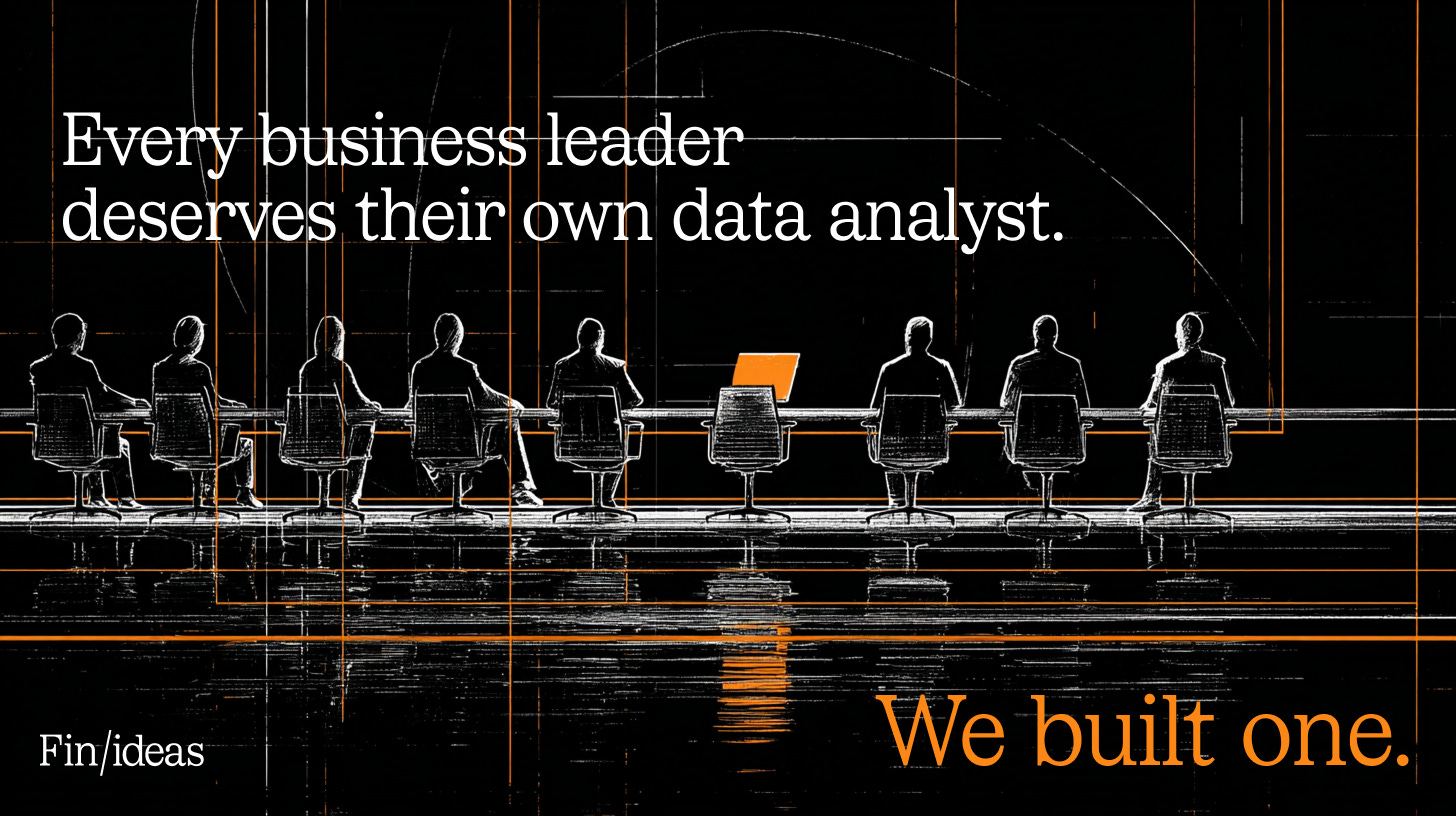
Every business leader deserves their own data analyst. We built one.
We spent 4 years building a world-class data foundation at Intercom. Trusted models, clean pipelines, proper documentation. And the people who needed it most couldn’t touch it.
When our President wanted to know why pipeline dropped, she filed a ticket with an analyst and waited.
That’s broken.
The access problem
It’s not that the data doesn’t exist. It’s that getting to it requires SQL and a dev environment. Business leaders don’t typically have those things, and they shouldn’t need them.
Meanwhile, generic AI tools can write SQL but they don’t know your data. They can’t tell the difference between your trusted source-of-truth table and the unvalidated one two schemas over. They give your VP a confidently wrong number, and they have no way to spot it.
The experiment that changed our minds
One of our engineers connected Claude Code to Snowflake for two business leaders as an experiment. The BizOps leader produced a private equity partner dashboard in minutes (previously days of analyst time). Our VP of Customer success diagnosed complex conversation volume trends solo.
Their response: “spectacular.”
But the setup needed terminal config, API keys, and multi-repo dependencies. We couldn’t scale that to 50 people, much less >400. So we built something that could.
What we built
We almost built a chatbot with a nice web UI. We didn’t. Because generic AI fails at business intelligence not because it lacks a pretty interface, but because it lacks opinion. Instead we built Claude for Data: an opinionated Agent on top of Claude Code, pre-loaded with our data team’s knowledge. Which tables to trust, how metrics are defined, where the gotchas are. Allowing it to start every session like a seasoned analyst who knows the business.
Four things made it work:
A zero-config installer. SSO auth for Snowflake connections, dependency checks, all handled invisibly. A business user gets their first answer in minutes. This was harder to build than any of the AI, and it mattered more for adoption than anything else we shipped.
A trust hierarchy. The Agent steers toward the best data model for the question. It knows a core, tested table from raw, unvalidated data. It can join across product usage, billing, and CRM to answer cross-functional questions.
A feedback loop. When something goes wrong, we capture the context. Domain experts review and update the guidance. Fixes reach every user automatically. Every bad answer makes the system better.
Shareable reports, and a portal to browse them. This turned out to be the real wow moment. A user can ask a question, get an answer, and then with a single command turn it into a polished, interactive report with charts and tables. That report gets published to the Claude4Data Catalog, a portal where anyone in the company can discover, browse, and learn from what others have built.
The catalog changed the dynamic completely. Before, insights lived and died in Slack threads. Now, someone in Sales can browse what Marketing built last week, fork it, adapt it for their own use case, and publish their version back. Reports show the SQL behind every number, so there’s full transparency on how the data was sourced. People leave comments directly on specific sections, ask follow-up questions, and star the reports they use regularly.
This is what made the tool go viral internally. They could see what their colleagues were producing, click through the catalog, and think “I want to build something like that.”
What happened
Within three weeks, weekly active users went from under 100 to nearly 400, mostly from non-technical teams. We’d planned a “Report of the Month” award to celebrate the best work in the catalog. We switched it to weekly because the output was too good to wait.
One member of a non-technical GTM team told us: “I truly believe this tool is the most transformative one I’ve ever seen in my career. My team is building new things every day, and we are not technical teams.”
A RevOps leader replaced a clunky weekly Tableau workflow with a self-serve dashboard in a single session. He called it “the data equivalent of a Waymo.” A Field Marketing manager built a live weekly report that evolved into a global marketing calendar used across the entire org, no data team ticket required. A Product Manager submitted her first-ever pull request to contribute a reusable analytics skill. Her reaction when it went live: “wowowowow.”
The last mile
Every GTM org we know is sitting on this problem: real investment in data, gated behind a small number of analysts. A decade of building dashboards hasn’t removed that bottleneck.
An opinionated Agent that knows what your data team knows, gets smarter from feedback, and turns conversations into reports people can actually share and build on. That’s the last mile.
Claude for Data is built on Anthropic’s Claude Code.
 |
|
Impressive work. A great example of agentic engineering best practices in action, especially encoded institutional knowledge, zero-config onboarding, and a feedback loop that makes the system better over time.